2020 New Construction Sales Statistics - Merano at D'Andrea

In February, 2021, I am posting 2020 sales data for each ongoing new construction subdivision in the Reno/Sparks market. This information is extracted from data published by the Washoe County Assessor. The square footage shown is from the assessor. Builders’ plans and the assessor’s measurements are often different. I have tried to pair the square footage with the corresponding floor plan advertised by the builder. This data includes only homes sold by the builder (resales have been omitted).

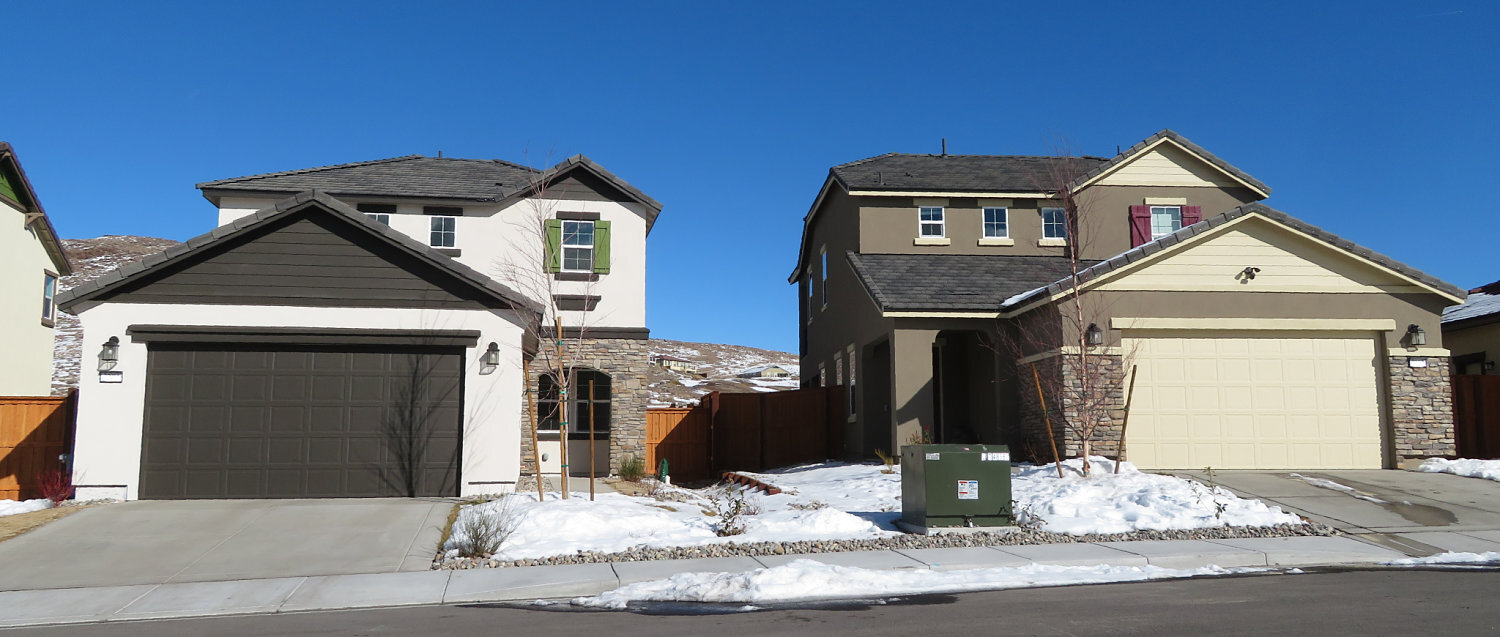
The homes in the Merano at D'Andrea subdivision are built by Lennar Homes. The average sales price of the 24 new construction homes sold in this neighborhood in 2020 was $640,254. The highest sales price was $794,096.

Merano at D'Andrea
Address Sales Date Sales Price Lot Size
Palantino (3,291 sq ft)
2901 GIOVANNI DR 11/25/2020 $768,026 0.20
2921 GIOVANNI DR 08/31/2020 $737,495 0.20
2931 GIOVANNI DR 08/17/2020 $716,160 0.25
2717 VECCHIO DR 06/22/2020 $794,096 0.33
2768 VECCHIO DR 05/15/2020 $612,508 0.25
2778 VECCHIO DR 05/13/2020 $586,695 0.23
2788 VECCHIO DR 04/29/2020 $580,828 0.25
3415 CAREGGI CT 04/14/2020 $647,804 0.19
3444 CAREGGI CT 03/17/2020 $558,577 0.18
3404 CAREGGI CT 02/11/2020 $654,046 0.26
3416 CAREGGI CT 01/31/2020 $638,049 0.22
3456 CAREGGI CT 01/10/2020 $526,295 0.33
Portofino (2,816 sq ft)
2747 VECCHIO DR 10/15/2020 $692,950 0.25
2737 VECCHIO DR 07/09/2020 $699,092 0.25
Versante (2,784 sq ft)
2911 GIOVANNI DR 11/19/2020 $704,442 0.18
2941 GIOVANNI DR 08/17/2020 $651,951 0.21
2951 GIOVANNI DR 07/28/2020 $655,000 0.27
2707 VECCHIO DR 06/23/2020 $689,327 0.32
2798 VECCHIO DR 05/08/2020 $549,950 0.26
3430 CAREGGI CT 01/31/2020 $524,673 0.18
Rapallo (2,622 sq ft)
2738 VECCHIO DR 10/02/2020 $554,950 0.24
2728 VECCHIO DR 06/15/2020 $548,615 0.21
Rapallo (2,617 sq ft)
2748 VECCHIO DR 12/08/2020 $599,210 0.23
2727 VECCHIO DR 06/19/2020 $675,353 0.22
Merano_opt.jpg

Make sure that if you visit a new construction sales center--even merely to collect initial information--take Ken or Alicia with you. Visit our website for more information on ongoing new construction projects in Reno-Sparks.

The information herein is based upon data from the Washoe County Assessor's Office for the time period specified. It is deemed reliable but not guaranteed; you are advised to independently assess the accuracy of any information presented.

2020 New Construction Sales Statistics - Ravenna at D'Andrea

In February, 2021, I am posting 2020 sales data for each ongoing new construction subdivision in the Reno/Sparks market. This information is extracted from data published by the Washoe County Assessor. The square footage shown is from the assessor. Builders’ plans and the assessor’s measurements are often different. I have tried to pair the square footage with the corresponding floor plan advertised by the builder. This data includes only homes sold by the builder (resales have been omitted).

The homes in the Ravenna at D'Andrea subdivision are built by Lennar Homes. The average sales price of the 42 new construction homes sold in this neighborhood in 2020 was $420,651. The highest sales price was $518,878.

Ravenna at D'Andrea
Address Sales Date Sales Price Lot Size
Santa Maria (2,680 sq ft)
3187 VATICAN DR 09/24/2020 $518,878 0.14
NOT SUPPLIED 04/27/2020 $511,571 0.23
Imperia (2,071 sq ft)
3236 PANTHEON DR 12/04/2020 $418,806 0.13
3212 PANTHEON DR 11/20/2020 $412,707 0.11
3222 CONSTANTINE DR 11/18/2020 $432,230 0.13
3163 VATICAN DR 10/27/2020 $416,146 0.11
3210 CONSTANTINE DR 10/16/2020 $447,473 0.11
3204 CONSTANTINE DR 09/28/2020 $433,430 0.12
3179 PANTHEON DR 08/31/2020 $439,421 0.14
3215 PANTHEON DR 07/24/2020 $415,665 0.12
3197 PANTHEON DR 07/15/2020 $436,001 0.12
3203 PANTHEON DR 07/10/2020 $424,431 0.12
3142 CONSTANTINE DR 05/11/2020 $386,950 0.13
3251 PANTHEON DR 04/27/2020 $408,607 0.12
3287 PANTHEON DR 03/11/2020 $418,726 0.14
3290 PANTHEON DR 03/09/2020 $413,843 0.15
Juniper (1,942 sq ft)
3086 CONSTANTINE DR 11/16/2020 $476,714 0.14
3180 CONSTANTINE DR 07/23/2020 $467,944 0.15
3168 CONSTANTINE DR 06/26/2020 $431,602 0.13
3156 CONSTANTINE DR 06/16/2020 $416,497 0.13
3130 CONSTANTINE DR 04/28/2020 $420,755 0.17
3106 CONSTANTINE DR 03/31/2020 $405,057 0.18
3094 CONSTANTINE DR 03/27/2020 $428,771 0.14
Genoa (1,893 sq ft)
3206 PANTHEON DR 12/15/2020 $425,345 0.11
3224 PANTHEON DR 11/25/2020 $420,478 0.11
3200 PANTHEON DR 11/23/2020 $424,744 0.13
3216 CONSTANTINE DR 10/29/2020 $431,079 0.11
3151 VATICAN DR 10/28/2020 $416,802 0.12
3175 VATICAN DR 09/29/2020 $406,802 0.12
3192 CONSTANTINE DR 09/15/2020 $422,020 0.13
3191 PANTHEON DR 08/26/2020 $390,128 0.12
3239 PANTHEON DR 05/29/2020 $373,565 0.12
3281 PANTHEON DR 03/20/2020 $365,115 0.10
3295 PANTHEON DR 03/11/2020 $413,500 0.37
Villa (1,578 sq ft)
3145 LIVORNO DR 11/24/2020 $406,089 0.12
3157 LIVORNO DR 09/24/2020 $411,448 0.12
3169 LIVORNO DR 09/24/2020 $401,448 0.14
3173 PANTHEON DR 08/18/2020 $411,448 0.17
3185 PANTHEON DR 07/27/2020 $405,950 0.12
3227 PANTHEON DR 06/11/2020 $393,393 0.12
3263 PANTHEON DR 04/16/2020 $388,232 0.12
3275 PANTHEON DR 03/18/2020 $377,519 0.12
Ravenna_opt.jpg

Make sure that if you visit a new construction sales center--even merely to collect initial information--take Ken or Alicia with you. Visit our website for more information on ongoing new construction projects in Reno-Sparks.

The information herein is based upon data from the Washoe County Assessor's Office for the time period specified. It is deemed reliable but not guaranteed; you are advised to independently assess the accuracy of any information presented.

2020 New Construction Sales Statistics - Cortina at D'Andrea Ranch

In February, 2021, I am posting 2020 sales data for each ongoing new construction subdivision in the Reno/Sparks market. This information is extracted from data published by the Washoe County Assessor. The square footage shown is from the assessor. Builders’ plans and the assessor’s measurements are often different. I have tried to pair the square footage with the corresponding floor plan advertised by the builder. This data includes only homes sold by the builder (resales have been omitted).

The homes in the Cortina at D'Andrea Ranch subdivision were built by Lennar Homes. The average sales price of the 8 new construction homes sold in this neighborhood in 2020 was $532,687. The highest sales price was $560,820.

Cortina at D'Andrea Ranch
Address Sales Date Sales Price Lot Size
2,816 sq ft
3135 VECCHIO DR 03/31/2020 $549,950 0.22
3110 VECCHIO DR 03/10/2020 $550,997 0.23
3145 VECCHIO DR 02/13/2020 $560,820 0.22
2,680 sq ft
3102 VECCHIO DR 11/04/2020 $524,522 0.18
3109 VECCHIO DR 10/22/2020 $535,563 0.18
3123 VECCHIO DR 02/28/2020 $520,000 0.25
3120 VECCHIO DR 02/26/2020 $510,283 0.20
2,622 sq ft
3151 VECCHIO DR 01/31/2020 $509,362 0.22
Cortina_opt.jpg

Make sure that if you visit a new construction sales center--even merely to collect initial information--take Ken or Alicia with you. Visit our website for more information on ongoing new construction projects in Reno-Sparks.

The information herein is based upon data from the Washoe County Assessor's Office for the time period specified. It is deemed reliable but not guaranteed; you are advised to independently assess the accuracy of any information presented.

2020 New Construction Sales Statistics - Silver Ridge II at Eagle Canyon

In February, 2021, I will be posting 2020 sales data for each ongoing new construction subdivision in the Reno/Sparks market. This information is extracted from data published by the Washoe County Assessor. The square footage shown is from the assessor. Builders’ plans and the assessor’s measurements are often different. I have tried to pair the square footage with the corresponding floor plan advertised by the builder. This data includes only homes sold by the builder (resales have been omitted).

The homes in the Silver Ridge II at Eagle Canyon subdivision are built by Lennar Homes. The average sales price of the 38 new construction homes sold in this neighborhood in 2020 was $487,988. The highest sales price was $547,605.

Silver Ridge II at Eagle Canyon
Address Sales Date Sales Price Lot Size
Conestoga (2,754 sq ft)
942 GARDEN POND WAY 10/28/2020 503,280 0.31
933 GARDEN POND WAY 09/23/2020 499,950 0.29
930 GARDEN POND WAY 08/10/2020 547,511 0.35
926 GARDEN POND WAY 07/27/2020 532,274 0.43
914 GARDEN POND WAY 06/23/2020 538,641 0.49
1176 MALLARD CREST DR 03/25/2020 499,950 0.37
1180 MALLARD CREST DR 03/20/2020 496,342 0.32
1175 MALLARD CREST DR 03/18/2020 547,605 0.51
1169 MALLARD CREST DR 02/28/2020 499,347 0.32
Shire (2,554 sq ft)
949 GARDEN POND WAY 12/10/2020 508,774 0.32
948 GARDEN POND WAY 11/05/2020 506,455 0.32
937 GARDEN POND WAY 10/29/2020 499,950 0.29
1172 MALLARD CREST DR 08/25/2020 530,602 0.38
934 GARDEN POND WAY 08/20/2020 493,950 0.30
918 GARDEN POND WAY 06/26/2020 499,950 0.41
910 GARDEN POND WAY 06/09/2020 514,805 0.38
906 GARDEN POND WAY 05/28/2020 496,160 0.35
1185 MALLARD CREST DR 04/14/2020 496,284 0.32
1165 MALLARD CREST DR 02/27/2020 479,350 0.30
1141 SPRUCE MEADOWS DR 02/13/2020 480,525 0.38
1140 SPRUCE MEADOWS DR 01/10/2020 474,950 0.29
Ponderosa (2,402 sq ft)
952 GARDEN POND WAY 11/19/2020 475,778 0.33
938 GARDEN POND WAY 09/18/2020 466,775 0.31
929 GARDEN POND WAY 09/04/2020 464,950 0.29
922 GARDEN POND WAY 07/24/2020 495,234 0.50
909 GARDEN POND WAY 05/27/2020 492,308 0.40
1188 MALLARD CREST DR 05/12/2020 471,418 0.34
1183 MALLARD CREST DR 04/09/2020 458,000 0.34
1173 MALLARD CREST DR 02/06/2020 462,341 0.38
Comstock (2,210 sq ft)
953 GARDEN POND WAY 12/14/2020 459,518 0.33
945 GARDEN POND WAY 11/18/2020 440,412 0.28
941 GARDEN POND WAY 11/09/2020 440,363 0.29
919 GARDEN POND WAY 06/08/2020 450,214 0.41
1184 MALLARD CREST DR 05/08/2020 419,950 0.33
1189 MALLARD CREST DR 04/29/2020 433,525 0.30
1179 MALLARD CREST DR 02/25/2020 419,950 0.38
Unknown
960 GARDEN POND WAY 12/22/2020 526,777 0.36
956 GARDEN POND WAY 12/11/2020 519,374 0.34
Silver Ridge 2_opt.jpg

Make sure that if you visit a new construction sales center--even merely to collect initial information--take Ken or Alicia with you. Visit our website for more information on ongoing new construction projects in Reno-Sparks.

The information herein is based upon data from the Washoe County Assessor's Office for the time period specified. It is deemed reliable but not guaranteed; you are advised to independently assess the accuracy of any information presented.

2020 New Construction Sales Statistics - Candelera and Sendero

In February, 2021, I will be posting 2020 sales data for each ongoing new construction subdivision in the Reno/Sparks market. This information is extracted from data published by the Washoe County Assessor. The square footage shown is from the assessor. Builders’ plans and the assessor’s measurements are often different. I have tried to pair the square footage with the corresponding floor plan advertised by the builder. This data includes only homes sold by the builder (resales have been omitted).

The homes in the Candelera and Sendero at Pioneer Meadows subdivisions are built by Lennar Homes. The average sales price of the 42 new construction homes sold in this neighborhood in 2020 was $421,798. The highest sales price was $592,596.

Pioneer Meadows - Sendero and Candelera
Address Sales Date Sales Price Lot Size
Santa Maria (2,680 sq ft)
2158 BISHOP PINE ST 12/28/2020 472,572 0.14
2136 MARCUS WAY 11/20/2020 492,596 0.19
2135 MARCUS WAY 11/17/2020 447,572 0.17
2115 MARCUS WAY 09/22/2020 465,000 0.14
2107 MARCUS WAY 07/21/2020 454,572 0.14
2094 MARCUS WAY 06/23/2020 473,812 0.18
2085 MARCUS WAY 06/15/2020 440,000 0.15
2020 ELK FALLS WAY 03/31/2020 453,568 0.20
2021 ELK FALLS WAY 03/30/2020 444,950 0.15
6986 WILD RIVER WAY 02/26/2020 438,494 0.14
6960 WILD RIVER WAY 01/03/2020 457,987 0.23
Aurora (2,482 sq ft)
2131 MARCUS WAY 11/05/2020 430,822 0.17
6973 SPENCER RIDGE CT 09/09/2020 450,267 0.22
2098 MARCUS WAY 06/26/2020 437,822 0.19
2097 MARCUS WAY 06/19/2020 428,329 0.14
2029 ELK FALLS WAY 05/29/2020 430,324 0.14
2025 ELK FALLS WAY 04/24/2020 409,395 0.14
6985 WILD RIVER WAY 02/28/2020 404,180 0.16
Silverado (2,323 sq ft)
2182 BISHOP PINE ST 12/15/2020 460,491 0.24
2127 MARCUS WAY 11/19/2020 434,143 0.16
2139 MARCUS WAY 11/12/2020 420,706 0.18
6985 SPENCER RIDGE CT 09/29/2020 408,777 0.19
6982 SPENCER RIDGE CT 08/26/2020 439,950 0.19
2103 MARCUS WAY 07/14/2020 386,950 0.14
2609 BRIDGETOWN LOOP 01/30/2020 404,894 0.17
2605 BRIDGETOWN LOOP 01/29/2020 395,336 0.17
Cottonwood (1,947 sq ft)
2170 BISHOP PINE ST 12/16/2020 433,233 0.14
2123 MARCUS WAY 09/30/2020 405,186 0.15
6997 SPENCER RIDGE CT 09/16/2020 425,613 0.23
6961 SPENCER RIDGE CT 08/28/2020 420,950 0.21
6970 SPENCER RIDGE CT 08/27/2020 429,950 0.26
2111 MARCUS WAY 07/22/2020 400,971 0.14
2104 MARCUS WAY 07/07/2020 403,950 0.24
2034 ELK FALLS WAY 04/16/2020 398,750 0.21
2030 ELK FALLS WAY 04/14/2020 406,801 0.18
2621 BRIDGETOWN LOOP 01/28/2020 406,304 0.17
Cheyenne (1,537 sq ft)
6998 WILD RIVER WAY 11/24/2020 370,790 0.16
2119 MARCUS WAY 09/29/2020 354,604 0.14
6994 SPENCER RIDGE CT 08/25/2020 382,495 0.19
2093 MARCUS WAY 06/17/2020 363,257 0.15
2026 ELK FALLS WAY 04/22/2020 373,126 0.18
2017 ELK FALLS WAY 03/18/2020 356,018 0.16
Sendaro_opt.jpg

Make sure that if you visit a new construction sales center--even merely to collect initial information--take Ken or Alicia with you. Visit our website for more information on ongoing new construction projects in Reno-Sparks.

The information herein is based upon data from the Washoe County Assessor's Office for the time period specified. It is deemed reliable but not guaranteed; you are advised to independently assess the accuracy of any information presented.

2020 New Construction Sales Statistics - Palisades

In February, 2021, I will be posting 2020 sales data for each ongoing new construction subdivision in the Reno/Sparks market. This information is extracted from data published by the Washoe County Assessor. The square footage shown is from the assessor. Builders’ plans and the assessor’s measurements are often different. I have tried to pair the square footage with the corresponding floor plan advertised by the builder. This data includes only homes sold by the builder (resales have been omitted).

The homes in the Palisades subdivision are built by Lennar Homes. The average sales price of the 30 new construction homes sold in this neighborhood in 2020 was $668,252. The highest sales price was $765,476.

Palisades
Address Sales Date Sales Price Lot Size
Palantino (3,336 sq ft)
10261 PALLADIUM MINE DR 11/06/2020 730,000 0.25
10281 PALLADIUM MINE DR 10/14/2020 759,120 0.26
10301 PALLADIUM MINE DR 09/08/2020 719,950 0.26
10311 PALLADIUM MINE DR 09/04/2020 701,676 0.26
10321 PALLADIUM MINE DR 06/15/2020 751,066 0.26
10331 PALLADIUM MINE DR 06/09/2020 706,678 0.27
10341 PALLADIUM MINE DR 05/08/2020 683,901 0.27
10351 PALLADIUM MINE DR 04/14/2020 688,712 0.27
10615 CLAIM JUMPER WAY 02/28/2020 765,476 0.19
10627 CLAIM JUMPER WAY 01/16/2020 686,764 0.36
Portofino (2,859 sq ft)
10240 PALLADIUM MINE DR 12/21/2020 664,950 0.22
10250 PALLADIUM MINE DR 12/10/2020 679,793 0.22
10280 PALLADIUM MINE DR 10/09/2020 659,950 0.22
10300 PALLADIUM MINE DR 07/14/2020 647,079 0.25
10310 PALLADIUM MINE DR 07/02/2020 681,266 0.25
10320 PALLADIUM MINE DR 05/14/2020 624,221 0.23
10330 PALLADIUM MINE DR 05/11/2020 650,636 0.24
10340 PALLADIUM MINE DR 02/26/2020 642,481 0.24
Versanti (2,800 sq ft)
10271 PALLADIUM MINE DR 10/21/2020 665,450 0.25
10291 PALLADIUM MINE DR 09/22/2020 682,804 0.26
10361 PALLADIUM MINE DR 07/28/2020 649,950 0.26
10621 CLAIM JUMPER WAY 05/15/2020 669,950 0.22
10591 CLAIM JUMPER WAY 03/12/2020 709,950 0.24
Rapallo (2,607 sq ft)
10230 PALLADIUM MINE DR 12/16/2020 636,299 0.22
10260 PALLADIUM MINE DR 12/07/2020 635,949 0.22
10270 PALLADIUM MINE DR 09/03/2020 624,299 0.22
10290 PALLADIUM MINE DR 08/14/2020 599,950 0.22
10326 PALLADIUM MINE DR 05/19/2020 589,333 0.24
10380 PALLADIUM MINE DR 01/31/2020 564,950 0.25
10350 PALLADIUM MINE DR 01/30/2020 574,950 0.24
Palisades_opt.jpg

Make sure that if you visit a new construction sales center--even merely to collect initial information--take Ken or Alicia with you. Visit our website for more information on ongoing new construction projects in Reno-Sparks.

The information herein is based upon data from the Washoe County Assessor's Office for the time period specified. It is deemed reliable but not guaranteed; you are advised to independently assess the accuracy of any information presented.

2020 New Construction Sales Statistics - Willow Flats at Kiley Ranch

In February, 2021, I am posting 2020 sales data for each ongoing new construction subdivision in the Reno/Sparks market. This information is extracted from data published by the Washoe County Assessor. The square footage shown is from the assessor. Builders’ plans and the assessor’s measurements are often different. I have tried to pair the square footage with the corresponding floor plan advertised by the builder. This data includes only homes sold by the builder (resales have been omitted).

The homes in the Willow Flats at Kiley Ranch subdivision are built by Lennar Homes. The average sales price of the 36 new construction homes sold in this neighborhood in 2020 was $407,605. The highest sales price was $442,430.

Willow Flats at Kiley Ranch
Address Sales Date Sales Price Lot Size
Babette (2,807 sq ft)
1134 RIDERS CT 12/09/2020 442,430 0.10
1150 RIDERS CT 10/14/2020 439,719 0.10
6121 RED SUN DR 09/25/2020 435,950 0.09
6130 RED SUN DR 09/22/2020 429,950 0.09
6106 RED SUN DR 08/21/2020 439,633 0.09
1127 WINTER HAWK WAY 05/11/2020 424,950 0.10
6092 RED SUN DR 03/20/2020 424,950 0.09
6072 RED SUN DR 03/04/2020 417,250 0.09
6052 RED SUN DR 02/20/2020 413,107 0.09
6059 RED SUN DR 02/19/2020 425,057 0.11
6022 RED SUN DR 01/23/2020 417,416 0.09
Bolero (2,447 sq ft)
1142 RIDERS CT 10/29/2020 424,487 0.10
6129 RED SUN DR 10/23/2020 421,820 0.10
1158 RIDERS CT 10/05/2020 417,450 0.10
6114 RED SUN DR 09/11/2020 416,739 0.09
1102 WINTER HAWK WAY 07/24/2020 426,951 0.14
6098 RED SUN DR 03/31/2020 389,950 0.09
6062 RED SUN DR 02/27/2020 392,950 0.09
6039 RED SUN DR 02/19/2020 389,950 0.09
6019 RED SUN DR 02/14/2020 389,950 0.09
6049 RED SUN DR 02/14/2020 389,950 0.10
6012 RED SUN DR 01/22/2020 408,888 0.09
Danver (2,170 sq ft)
1126 RIDERS CT 12/29/2020 416,986 0.11
1123 RIDERS CT 11/20/2020 418,688 0.14
1143 RIDERS CT 11/16/2020 404,586 0.10
6122 RED SUN DR 09/21/2020 397,205 0.09
6113 RED SUN DR 08/20/2020 390,000 0.09
6105 RED SUN DR 08/13/2020 398,810 0.10
1112 WINTER HAWK WAY 07/22/2020 389,200 0.10
1107 WINTER HAWK WAY 07/09/2020 379,950 0.09
6082 RED SUN DR 06/12/2020 388,515 0.09
1117 WINTER HAWK WAY 05/11/2020 379,519 0.10
6069 RED SUN DR 02/28/2020 388,767 0.12
6029 RED SUN DR 02/10/2020 374,950 0.09
6042 RED SUN DR 02/04/2020 378,649 0.09
6032 RED SUN DR 01/29/2020 388,452 0.09
Willow Flat_opt.jpg

Make sure that if you visit a new construction sales center--even merely to collect initial information--take Ken or Alicia with you. Visit our website for more information on ongoing new construction projects in Reno-Sparks.

The information herein is based upon data from the Washoe County Assessor's Office for the time period specified. It is deemed reliable but not guaranteed; you are advised to independently assess the accuracy of any information presented.

2020 New Construction Sales Statistics - Cabernet Highlands - Bianco and Rosso

In February, 2021, I will be posting 2020 sales data for each ongoing new construction subdivision in the Reno/Sparks market. This information is extracted from data published by the Washoe County Assessor. The square footage shown is from the assessor. Builders’ plans and the assessor’s measurements are often different. I have tried to pair the square footage with the corresponding floor plan advertised by the builder. This data includes only homes sold by the builder (resales have been omitted).

The homes in the Bianco and Rosso at Cabernet Highlands subdivisions are built by Lennar Homes. The average sales price of the 55 new construction homes sold in this neighborhood in 2020 was $427,438. The highest sales price was $516,041.

Cabernet Highlands - Bianco and Rosso
Address Sales Date Sales Price Lot Size
Shire (2,563 sq ft)
7365 SOUVERAIN LN 07/27/2020 489,950 0.26
7370 SOUVERAIN LN 07/13/2020 489,950 0.21
7355 SOUVERAIN LN 05/29/2020 513,118 0.28
7280 SOUVERAIN LN 03/19/2020 454,950 0.18
7290 SOUVERAIN LN 03/12/2020 464,950 0.20
7310 SOUVERAIN LN 02/27/2020 489,249 0.21
7295 SOUVERAIN LN 01/23/2020 486,807 0.36
Ponderosa (2,402 sq ft)
7385 SOUVERAIN LN 09/01/2020 497,167 0.22
7375 SOUVERAIN LN 07/13/2020 474,413 0.24
7335 SOUVERAIN LN 06/15/2020 462,413 0.28
7275 SOUVERAIN LN 06/15/2020 424,950 0.19
7305 SOUVERAIN LN 06/10/2020 439,950 0.21
7330 SOUVERAIN LN 04/28/2020 455,000 0.21
7300 SOUVERAIN LN 03/30/2020 449,950 0.21
7285 SOUVERAIN LN 01/22/2020 460,000 0.33
Comstock (2,195 sq ft)
7380 SOUVERAIN LN 09/03/2020 429,950 0.21
7340 SOUVERAIN LN 05/27/2020 434,950 0.26
7320 SOUVERAIN LN 05/27/2020 429,950 0.21
7325 SOUVERAIN LN 03/31/2020 451,922 0.28
7315 SOUVERAIN LN 03/02/2020 414,000 0.21
Sandstone (2,178 sq ft)
7322 OVERTURE DR 07/31/2020 393,000 0.14
7336 CONTINUUM DR 07/13/2020 397,950 0.16
7320 CONTINUUM DR 05/27/2020 419,950 0.27
7329 CONTINUUM DR 04/21/2020 399,913 0.15
7340 CONTINUUM DR 02/14/2020 372,950 0.16
7356 CONTINUUM DR 01/17/2020 369,950 0.16
Juniper (1,943 sq ft)
7324 CONTINUUM DR 09/30/2020 412,000 0.20
7325 OVERTURE DR 09/18/2020 394,950 0.14
7317 CONTINUUM DR 07/20/2020 399,950 0.14
7325 CONTINUUM DR 06/26/2020 384,950 0.15
7333 CONTINUUM DR 05/27/2020 389,950 0.15
7332 CONTINUUM DR 04/15/2020 413,820 0.17
7344 CONTINUUM DR 02/14/2020 370,000 0.15
Pinon (1,725 sq ft)
7328 CONTINUUM DR 08/12/2020 369,950 0.18
7313 CONTINUUM DR 07/30/2020 359,950 0.14
7321 CONTINUUM DR 07/17/2020 369,950 0.14
7309 CONTINUUM DR 06/30/2020 360,000 0.16
7337 CONTINUUM DR 03/11/2020 369,950 0.15
7341 CONTINUUM DR 01/22/2020 359,950 0.15
7349 CONTINUUM DR 01/09/2020 359,950 0.15
Unknown
7313 OVERTURE DR 12/16/2020 413,913 0.15
7445 HUNDRED ACRE DR 12/14/2020 484,707 0.23
7317 OVERTURE DR 12/11/2020 396,950 0.15
7425 SOUVERAIN LN 11/25/2020 469,950 0.25
7435 SOUVERAIN LN 11/24/2020 459,988 0.26
7415 SOUVERAIN LN 11/13/2020 516,041 0.22
7400 SOUVERAIN LN 11/13/2020 447,642 0.18
7410 SOUVERAIN LN 11/06/2020 502,502 0.20
7405 SOUVERAIN LN 10/26/2020 443,142 0.21
7321 OVERTURE DR 10/22/2020 379,084 0.14
7395 SOUVERAIN LN 10/20/2020 439,950 0.21
7318 OVERTURE DR 10/16/2020 414,572 0.15
7390 SOUVERAIN LN 10/05/2020 472,038 0.18
CLOUD BREAK DR 07/31/2020 393,000 2.91
CLOUD BREAK DR 07/31/2020 393,000 2.56

Make sure that if you visit a new construction sales center--even merely to collect initial information--take Ken or Alicia with you. Visit our website for more information on ongoing new construction projects in Reno-Sparks.

The information herein is based upon data from the Washoe County Assessor's Office for the time period specified. It is deemed reliable but not guaranteed; you are advised to independently assess the accuracy of any information presented.

2020 New Construction Sales Statistics - Chantenay at Damonte Ranch

In February, 2021, I will be posting 2020 sales data for each ongoing new construction subdivision in the Reno/Sparks market. This information is extracted from data published by the Washoe County Assessor. The square footage shown is from the assessor. Builders’ plans and the assessor’s measurements are often different. I have tried to pair the square footage with the corresponding floor plan advertised by the builder. This data includes only homes sold by the builder (resales have been omitted).

The homes in the Chantenay at Damonte Ranch subdivision are built by Lennar Homes. The average sales price of the 31 new construction homes sold in this neighborhood in 2020 was $461,620. The highest sales price was $521,527.

Chantenay at Damonte Ranch
Address Sales Date Sales Price Lot Size
Babette (2,817 sq ft)
9743 QUARTETTE DR 10/12/2020 502,430 0.10
9740 QUARTETTE DR 09/02/2020 521,527 0.10
9732 BELVILLE DR 07/06/2020 477,950 0.10
9730 BELVILLE DR 03/13/2020 479,950 0.10
9729 BELVILLE DR 03/06/2020 479,950 0.10
9728 BELVILLE DR 02/25/2020 461,390 0.10
9724 BELVILLE DR 02/25/2020 469,950 0.11
9727 BELVILLE DR 01/30/2020 469,950 0.10
Bolero (2,447 sq ft)
9744 QUARTETTE DR 09/25/2020 458,513 0.10
9741 QUARTETTE DR 08/31/2020 469,950 0.10
9738 QUARTETTE DR 08/06/2020 468,267 0.10
9737 QUARTETTE DR 07/24/2020 460,199 0.10
9788 QUARTETTE DR 05/27/2020 483,076 0.15
9737 BELVILLE DR 04/23/2020 443,110 0.10
9736 BELVILLE DR 03/26/2020 444,189 0.10
9733 BELVILLE DR 02/06/2020 456,137 0.10
9731 BELVILLE DR 01/08/2020 439,950 0.10
Danver (2,170 sq ft)
9745 QUARTETTE DR 11/06/2020 459,838 0.10
9742 QUARTETTE DR 09/21/2020 459,838 0.10
9739 QUARTETTE DR 08/27/2020 451,075 0.10
9736 QUARTETTE DR 07/23/2020 449,950 0.10
9735 QUARTETTE DR 07/08/2020 449,922 0.10
9786 QUARTETTE DR 06/01/2020 469,756 0.14
9790 QUARTETTE DR 05/13/2020 435,129 0.13
9739 BELVILLE DR 04/24/2020 439,857 0.12
9734 BELVILLE DR 03/19/2020 430,143 0.10
9735 BELVILLE DR 02/07/2020 415,679 0.10
Korel (1,877 sq ft)
9747 QUARTETTE DR 10/28/2020 470,636 0.11
9782 QUARTETTE DR 08/11/2020 486,508 0.25
9784 QUARTETTE DR 07/08/2020 460,000 0.20
9792 QUARTETTE DR 05/29/2020 445,407 0.12
Chantenay_opt.jpg

Make sure that if you visit a new construction sales center--even merely to collect initial information--take Ken or Alicia with you. Visit our website for more information on ongoing new construction projects in Reno-Sparks.

The information herein is based upon data from the Washoe County Assessor's Office for the time period specified. It is deemed reliable but not guaranteed; you are advised to independently assess the accuracy of any information presented.

2020 New Construction Sales Statistics - Stonefield - Arvada and Peavine Trails

In February, 2021, I will be posting 2020 sales data for each ongoing new construction subdivision in the Reno/Sparks market. This information is extracted from data published by the Washoe County Assessor. The square footage shown is from the assessor. Builders’ plans and the assessor’s measurements are often different. I have tried to pair the square footage with the corresponding floor plan advertised by the builder. This data includes only homes sold by the builder (resales have been omitted).

The homes in the Arvada and Peavine Trails at Stonefield subdivisions are built by Lennar Homes. The average sales price of the 49 new construction homes sold in this neighborhood in 2020 was $366,250. The highest sales price was $430,197.

Stonefield - Arvada and Peavine Trails
Address Sales Date Sales Price Lot Size
Jasper (2,680 sq ft)
8918 QUAIL FALLS DR 12/10/2020 430,197 0.15
8907 QUAIL FALLS DR 12/04/2020 409,950 0.15
8873 MAHON DR 08/28/2020 399,950 0.32
8861 MAHON DR 07/17/2020 389,617 0.16
504 EAGLE BLUFF CT 03/25/2020 409,485 0.30
8847 MAHON DR 03/05/2020 390,000 0.25
Carnelian (2,480 sq ft)
8914 QUAIL FALLS DR 11/25/2020 384,950 0.15
8913 QUAIL FALLS DR 11/06/2020 387,960 0.15
8909 QUAIL FALLS DR 10/29/2020 404,704 0.15
8865 MAHON DR 08/20/2020 385,298 0.16
8853 MAHON DR 03/30/2020 389,391 0.22
507 EAGLE BLUFF CT 03/13/2020 399,950 0.36
8843 MAHON DR 02/28/2020 379,950 0.22
Emery (2,290 sq ft)
8916 QUAIL FALLS DR 11/25/2020 382,620 0.15
8908 QUAIL FALLS DR 11/17/2020 376,075 0.15
8911 QUAIL FALLS DR 11/13/2020 379,305 0.15
8905 QUAIL FALLS DR 10/05/2020 371,380 0.15
8901 QUAIL FALLS DR 09/29/2020 385,129 0.19
8903 QUAIL FALLS DR 09/29/2020 384,208 0.15
8869 MAHON DR 08/21/2020 384,730 0.21
502 EAGLE BLUFF CT 03/16/2020 384,297 0.28
503 EAGLE BLUFF CT 03/11/2020 384,332 0.26
8837 MAHON DR 02/20/2020 369,950 0.21
Onyx (2,120 sq ft)
8857 MAHON DR 06/30/2020 339,000 0.16
501 EAGLE BLUFF CT 05/08/2020 359,950 0.20
8833 MAHON DR 04/09/2020 349,950 0.20
Peridot (1,907 sq ft)
8870 MAHON DR 11/05/2020 364,005 0.11
8866 MAHON DR 10/29/2020 350,980 0.11
8864 MAHON DR 10/26/2020 354,583 0.11
8862 MAHON DR 10/22/2020 349,400 0.11
8860 MAHON DR 09/25/2020 345,372 0.11
8856 MAHON DR 08/25/2020 347,219 0.13
8852 MAHON DR 08/14/2020 340,950 0.15
8844 MAHON DR 06/29/2020 344,950 0.13
8848 MAHON DR 06/15/2020 333,537 0.15
8840 MAHON DR 03/10/2020 329,950 0.13
8836 MAHON DR 02/24/2020 324,950 0.13
Pietra (1,710 sq ft)
8868 MAHON DR 11/02/2020 331,950 0.11
8858 MAHON DR 09/23/2020 324,950 0.12
8854 MAHON DR 08/26/2020 324,683 0.14
8850 MAHON DR 07/09/2020 319,950 0.16
8846 MAHON DR 04/23/2020 329,950 0.13
8842 MAHON DR 03/26/2020 319,950 0.12
8838 MAHON DR 03/02/2020 319,950 0.13
Unknown
8917 QUAIL FALLS DR 12/29/2020 385,950 0.15
8920 QUAIL FALLS DR 12/23/2020 366,305 0.15
8919 QUAIL FALLS DR 12/18/2020 405,108 0.16
8915 QUAIL FALLS DR 12/11/2020 364,353 0.15
8912 QUAIL FALLS DR 11/23/2020 354,950 0.15
Arvada_opt.jpg

Make sure that if you visit a new construction sales center--even merely to collect initial information--take Ken or Alicia with you. Visit our website for more information on ongoing new construction projects in Reno-Sparks.

The information herein is based upon data from the Washoe County Assessor's Office for the time period specified. It is deemed reliable but not guaranteed; you are advised to independently assess the accuracy of any information presented.

2020 New Construction Sales Statistics - Ironwood at Kiley Ranch

In February, 2021, I am posting 2020 sales data for each ongoing new construction subdivision in the Reno/Sparks market. This information is extracted from data published by the Washoe County Assessor. The square footage shown is from the assessor. Builders’ plans and the assessor’s measurements are often different. I have tried to pair the square footage with the corresponding floor plan advertised by the builder. This data includes only homes sold by the builder (resales have been omitted).

The homes in the Ironwood at Kiley Ranch subdivision are built by Lennar Homes. The average sales price of the 37 new construction homes sold in this neighborhood in 2020 was $473,892. The highest sales price was $545,451

Ironwood at Kiley Ranch
Address Sales Date Sales Price Lot Size
Kensington (3,180 sq ft)
6170 HAY WAGON TRL 11/04/2020 514,950 0.15
6178 HAY WAGON TRL 10/27/2020 514,543 0.15
6194 HAY WAGON TRL 09/11/2020 508,950 0.14
6185 RED STABLE RD 08/04/2020 499,950 0.14
1342 RAINFALL RD 07/29/2020 509,950 0.14
6200 RED STABLE RD 07/27/2020 545,451 0.31
6208 RED STABLE RD 07/13/2020 512,265 0.14
6201 RED STABLE RD 06/30/2020 494,950 0.15
6177 RED STABLE RD 05/14/2020 489,732 0.16
6153 RED STABLE RD 04/17/2020 510,008 0.14
6162 RED STABLE RD 04/02/2020 501,703 0.14
6156 RED STABLE RD 04/02/2020 499,841 0.14
6156 SHANGO ST 02/28/2020 471,125 0.14
6163 BEARCAT DR 01/21/2020 469,950 0.14
Lucchese (2,822 sq ft)
1302 RAINFALL RD 12/21/2020 455,920 0.14
1312 RAINFALL RD 12/11/2020 454,999 0.14
1322 RAINFALL RD 11/24/2020 456,076 0.14
6179 HAY WAGON TRL 10/16/2020 460,825 0.16
6193 RED STABLE RD 08/05/2020 432,430 0.14
6145 RED STABLE RD 06/12/2020 426,968 0.14
6169 RED STABLE RD 04/30/2020 441,251 0.17
6161 RED STABLE RD 04/21/2020 432,999 0.15
6168 RED STABLE RD 04/07/2020 442,210 0.16
Abetta (2,288 sq ft)
1307 RAINFALL RD 12/23/2020 489,570 0.16
1317 RAINFALL RD 11/25/2020 476,398 0.14
1327 RAINFALL RD 11/23/2020 471,302 0.16
1332 RAINFALL RD 11/17/2020 476,528 0.14
6153 HAY WAGON TRL 09/28/2020 464,730 0.14
6165 HAY WAGON TRL 09/24/2020 475,973 0.18
6186 HAY WAGON TRL 09/17/2020 464,074 0.14
6216 RED STABLE RD 04/30/2020 458,195 0.14
6224 RED STABLE RD 04/23/2020 468,705 0.14
1362 RAINFALL RD 04/17/2020 453,195 0.14
1372 RAINFALL RD 04/16/2020 455,877 0.15
1352 RAINFALL RD 04/10/2020 439,950 0.14
6150 RED STABLE RD 03/05/2020 434,950 0.14
6142 RED STABLE RD 02/27/2020 457,519 0.14
Ironwood_opt.jpg

Make sure that if you visit a new construction sales center--even merely to collect initial information--take Ken or Alicia with you. Visit our website for more information on ongoing new construction projects in Reno-Sparks.

The information herein is based upon data from the Washoe County Assessor's Office for the time period specified. It is deemed reliable but not guaranteed; you are advised to independently assess the accuracy of any information presented.

2020 New Construction Sales Statistics - Homestead at Kiley Ranch

In February, 2021, I am posting 2020 sales data for each ongoing new construction subdivision in the Reno/Sparks market. This information is extracted from data published by the Washoe County Assessor. The square footage shown is from the assessor. Builders’ plans and the assessor’s measurements are often different. I have tried to pair the square footage with the corresponding floor plan advertised by the builder. This data includes only homes sold by the builder (resales have been omitted).

The homes in the Homestead at Kiley Ranch subdivision are built by Lennar Homes. The average sales price of the 45 new construction homes sold in this neighborhood in 2020 was $405,597. The highest sales price was $444,120.

Homestead at Kiley Ranch
Address Sales Date Sales Price Lot Size
Sandstone (2,174 sq ft)
1213 GREY OWL DR 8/25/2020 409,950 0.13
1202 GREY OWL DR 6/30/2020 419,950 0.115
6128 FARM HOUSE DR 6/8/2020 404,950 0.115
1189 GREY OWL DR 5/28/2020 418,682 0.115
6170 FARM HOUSE CT 3/19/2020 405,312 0.115
1235 BARN OWL DR 2/12/2020 396,036 0.115
1236 BARN OWL DR 2/5/2020 393,974 0.115
1222 BARN OWL DR 1/17/2020 394,716 0.135
Juniper (1,950 sq ft)
1243 GREY OWL DR 11/25/2020 444,120 0.115
1201 GREY OWL DR 8/28/2020 424,950 0.115
1208 GREY OWL DR 7/24/2020 424,950 0.115
1194 GREY OWL DR 6/25/2020 419,950 0.115
1195 GREY OWL DR 6/22/2020 430,373 0.115
1182 GREY OWL DR 5/27/2020 428,776 0.115
1177 GREY OWL DR 5/19/2020 429,017 0.115
1170 GREY OWL DR 4/28/2020 412,848 0.115
6146 FARM HOUSE DR 3/13/2020 409,467 0.115
6134 FARM HOUSE DR 3/10/2020 412,170 0.115
6152 FARM HOUSE DR 2/25/2020 423,685 0.115
1229 BARN OWL DR 1/28/2020 421,420 0.115
Pinon (1,719 sq ft)
1248 GREY OWL DR 12/17/2020 419,781 0.115
1240 GREY OWL DR 12/10/2020 435,368 0.115
1218 GREY OWL DR 11/20/2020 410,547 0.175
1230 GREY OWL DR 10/27/2020 409,084 0.169
1225 GREY OWL DR 9/18/2020 419,950 0.132
1207 GREY OWL DR 9/11/2020 419,950 0.115
1183 GREY OWL DR 6/11/2020 406,369 0.115
1165 GREY OWL DR 5/1/2020 405,209 0.136
6175 FARM HOUSE CT 3/25/2020 399,950 0.25
6122 FARM HOUSE DR 3/20/2020 399,886 0.115
6164 FARM HOUSE CT 3/16/2020 408,078 0.115
6140 FARM HOUSE DR 3/5/2020 391,274 0.115
6158 FARM HOUSE CT 2/21/2020 374,950 0.115
1242 BARN OWL DR 2/11/2020 386,950 0.131
Tule (1,620 sq ft)
1237 GREY OWL DR 12/11/2020 396,950 0.131
1231 GREY OWL DR 11/13/2020 419,743 0.136
1219 GREY OWL DR 9/15/2020 389,950 0.13
1176 GREY OWL DR 7/21/2020 389,950 0.115
1188 GREY OWL DR 6/25/2020 397,257 0.115
1171 GREY OWL DR 5/13/2020 392,676 0.115
1164 GREY OWL DR 4/22/2020 372,954 0.136
6110 FARM HOUSE DR 4/10/2020 377,019 0.115
6116 FARM HOUSE DR 3/31/2020 374,422 0.115
1241 BARN OWL DR 2/18/2020 362,760 0.136
1230 BARN OWL DR 2/4/2020 365,555 0.115
Homestead_opt.jpg

Make sure that if you visit a new construction sales center--even merely to collect initial information--take Ken or Alicia with you. Visit our website for more information on ongoing new construction projects in Reno-Sparks.

The information herein is based upon data from the Washoe County Assessor's Office for the time period specified. It is deemed reliable but not guaranteed; you are advised to independently assess the accuracy of any information presented.

2020 New Construction Sales Statistics - Parc Forêt at Montrêux

In February, 2021, I will be posting 2020 sales data for each ongoing new construction subdivision in the Reno/Sparks market. This information is extracted from data published by the Washoe County Assessor. The square footage shown is from the assessor. Builders’ plans and the assessor’s measurements are often different. I have tried to pair the square footage with the corresponding floor plan advertised by the builder. This data includes only homes sold by the builder (resales have been omitted).

The homes in the Parc Forêt at Montrêux subdivision are built by LakeCrest Builders. The average sales price of the 3 new construction homes sold in this neighborhood in 2020 was $2,014,512. The highest sales price was $2,166,132.

Parc Forêt at Montrêux
Address Sales Date Sales Price Sq Ft Acres
5060 BORDEAUX CT 03/17/2020 $2,166,132 4,470 0.50
5072 BORDEAUX CT 03/09/2020 $2,115,415 4,470 0.52
5048 BORDEAUX CT 05/14/2020 $1,761,990 3,241 0.47
Montreux Golf_opt.jpg

Make sure that if you visit a new construction sales center--even merely to collect initial information--take Ken or Alicia with you. Visit our website for more information on ongoing new construction projects in Reno-Sparks.

The information herein is based upon data from the Washoe County Assessor's Office for the time period specified. It is deemed reliable but not guaranteed; you are advised to independently assess the accuracy of any information presented.

2020 New Construction Sales Statistics - Holcomb Ranch

In February, 2021, I will be posting 2020 sales data for each ongoing new construction subdivision in the Reno/Sparks market. This information is extracted from data published by the Washoe County Assessor. The square footage shown is from the assessor. Builders’ plans and the assessor’s measurements are often different. I have tried to pair the square footage with the corresponding floor plan advertised by the builder. This data includes only homes sold by the builder (resales have been omitted).

The homes in the Holcomb Ranch subdivision are built by Desert Wind Homes. One new construction home sold in this new neighborhood in 2020 for $696,875 on a 0.15 acre lot.

Holcomb+Ranch_opt.jpg

Make sure that if you visit a new construction sales center--even merely to collect initial information--take Ken or Alicia with you. Visit our website for more information on ongoing new construction projects in Reno-Sparks.

The information herein is based upon data from the Washoe County Assessor's Office for the time period specified. It is deemed reliable but not guaranteed; you are advised to independently assess the accuracy of any information presented.

2020 New Construction Sales Statistics - Eagle Canyon Ranch

In February, 2021, I will be posting 2020 sales data for each ongoing new construction subdivision in the Reno/Sparks market. This information is extracted from data published by the Washoe County Assessor. The square footage shown is from the assessor. Builders’ plans and the assessor’s measurements are often different. I have tried to pair the square footage with the corresponding floor plan advertised by the builder. This data includes only homes sold by the builder (resales have been omitted).

The homes in the Eagle Canyon Ranch subdivision are built by Capstone Communities. The average sales price of the 29 new construction homes sold in this neighborhood in 2020 was $443,923. The highest sales price was $489,413.

Eagle Canyon Ranch
Address Sales Date Sales Price Sq Ft Lot Size
740 TUFA DR 07/10/2020 $450,780 2,690 0.35
739 TUFA DR 06/05/2020 $461,245 2,690 0.28
621 PLAYA PL 05/22/2020 $457,607 2,690 0.29
680 SILVER CITY RD 05/05/2020 $489,413 2,690 0.33
684 SILVER CITY RD 04/24/2020 $485,897 2,690 0.33
694 SILVER CITY RD 04/08/2020 $467,965 2,690 0.48
681 SILVER CITY RD 01/17/2020 $458,304 2,690 0.76
732 TUFA DR 07/09/2020 $457,035 2,408 0.30
716 TUFA DR 07/02/2020 $445,868 2,408 0.20
747 TUFA DR 06/12/2020 $462,335 2,408 0.36
611 PLAYA PL 05/26/2020 $448,953 2,408 0.36
631 PLAYA PL 05/12/2020 $453,454 2,408 0.28
620 PLAYA PL 03/06/2020 $457,529 2,408 0.20
640 PLAYA PL 02/21/2020 $450,996 2,408 0.20
670 PLAYA PL 01/27/2020 $436,870 2,408 0.37
748 TUFA DR 08/31/2020 $445,570 2,252 0.40
724 TUFA DR 07/28/2020 $435,310 2,252 0.22
NOT SUPPLIED 06/02/2020 $440,821 2,252 0.30
690 SILVER CITY RD 04/20/2020 $463,572 2,252 0.33
700 TUFA DR 04/14/2020 $417,183 2,252 0.27
708 TUFA DR 04/01/2020 $448,950 2,252 0.21
630 PLAYA PL 02/25/2020 $433,131 2,252 0.20
660 PLAYA PL 02/06/2020 $437,226 2,252 0.20
801 LEXINGTON ARCH DR 01/13/2020 $425,160 2,252 0.28
116 MIDAS CT 09/16/2020 $404,947 1,935 0.29
600 PLAYA PL 07/31/2020 $407,920 1,935 0.29
610 PLAYA PL 04/03/2020 $417,147 1,935 0.21
650 PLAYA PL 03/27/2020 $407,400 1,935 0.20
691 SILVER CITY RD 01/09/2020 $405,180 1,935 0.35
Eagle+Canyon+Ranch_opt.jpg

Make sure that if you visit a new construction sales center--even merely to collect initial information--take Ken or Alicia with you. Visit our website for more information on ongoing new construction projects in Reno-Sparks.

The information herein is based upon data from the Washoe County Assessor's Office for the time period specified. It is deemed reliable but not guaranteed; you are advised to independently assess the accuracy of any information presented.

2020 New Construction Sales Statistics - Silver Canyon

In February, 2021, I will be posting 2020 sales data for each ongoing new construction subdivision in the Reno/Sparks market. This information is extracted from data published by the Washoe County Assessor. The square footage shown is from the assessor. Builders’ plans and the assessor’s measurements are often different. I have tried to pair the square footage with the corresponding floor plan advertised by the builder. This data includes only homes sold by the builder (resales have been omitted).

The homes in the Silver Canyon subdivision are built by Silverado Homes. The average sales price of the 58 new construction homes sold in this neighborhood in 2020 was $466,311. The highest sales price was $546,725.

Silver Canyon
Address Sales Date Sales Price Sq Ft Lot Size
702 TEN PENNY DR 11/13/2020 $546,725 2,810 0.29
713 TEN PENNY DR 10/16/2020 $532,341 2,810 0.24
718 TEN PENNY DR 09/14/2020 $544,449 2,810 0.24
742 TEN PENNY DR 07/17/2020 $577,282 2,810 0.24
733 TEN PENNY DR 07/08/2020 $497,219 2,810 0.24
620 COULEE MEADOW DR 06/02/2020 $531,508 2,810 0.29
621 COULEE MEADOW DR 05/27/2020 $504,297 2,810 0.27
2151 KINGSTON CANYON DR 05/11/2020 $535,727 2,810 0.22
551 COULEE MEADOW DR 01/22/2020 $528,609 2,810 0.22
2187 KINGSTON CANYON DR 10/09/2020 $471,119 2,613 0.21
726 TEN PENNY DR 08/28/2020 $502,595 2,613 0.24
610 COULEE MEADOW DR 05/08/2020 $476,859 2,613 0.22
601 COULEE MEADOW DR 04/27/2020 $507,535 2,613 0.22
2159 KINGSTON CANYON DR 04/01/2020 $546,551 2,613 0.22
540 COULEE MEADOW DR 02/21/2020 $458,195 2,613 0.22
709 TEN PENNY DR 11/05/2020 $492,292 2,446 0.24
734 TEN PENNY DR 08/19/2020 $509,933 2,446 0.24
737 TEN PENNY DR 07/07/2020 $482,411 2,446 0.24
745 TEN PENNY DR 06/12/2020 $474,554 2,446 0.28
2175 KINGSTON CANYON DR 06/10/2020 $467,286 2,446 0.22
2167 KINGSTON CANYON DR 05/20/2020 $451,110 2,446 0.23
581 COULEE MEADOW DR 04/07/2020 $455,225 2,446 0.22
580 COULEE MEADOW DR 03/24/2020 $498,374 2,446 0.22
560 COULEE MEADOW DR 02/21/2020 $480,641 2,446 0.22
701 TEN PENNY DR 11/13/2020 $483,560 2,262 0.28
725 TEN PENNY DR 08/12/2020 $480,057 2,262 0.24
721 TEN PENNY DR 08/11/2020 $471,493 2,262 0.24
600 COULEE MEADOW DR 05/13/2020 $432,563 2,262 0.22
2195 KINGSTON CANYON DR 11/13/2020 $453,109 2,134 0.20
706 TEN PENNY DR 10/08/2020 $463,445 2,134 0.21
705 TEN PENNY DR 09/28/2020 $431,296 2,134 0.21
2183 KINGSTON CANYON DR 09/01/2020 $430,492 2,134 0.20
730 TEN PENNY DR 08/14/2020 $462,716 2,134 0.21
746 TEN PENNY DR 07/15/2020 $424,914 2,134 0.24
741 TEN PENNY DR 06/17/2020 $438,045 2,134 0.22
2171 KINGSTON CANYON DR 05/20/2020 $480,429 2,134 0.20
611 COULEE MEADOW DR 04/29/2020 $462,176 2,134 0.20
590 COULEE MEADOW DR 03/26/2020 $448,814 2,134 0.20
591 COULEE MEADOW DR 03/19/2020 $444,153 2,134 0.20
571 COULEE MEADOW DR 02/19/2020 $451,958 2,134 0.20
1221 SPRUCE MEADOWS DR 02/07/2020 $448,785 2,134 0.26
550 COULEE MEADOW DR 01/31/2020 $422,331 2,134 0.20
541 COULEE MEADOW DR 01/17/2020 $442,138 2,134 0.20
717 TEN PENNY DR 09/10/2020 $420,129 1,934 0.21
722 TEN PENNY DR 08/27/2020 $434,414 1,934 0.21
561 COULEE MEADOW DR 02/14/2020 $398,554 1,934 0.20
2191 KINGSTON CANYON DR 10/15/2020 $415,410 1,762 0.20
714 TEN PENNY DR 09/25/2020 $417,282 1,762 0.21
729 TEN PENNY DR 08/07/2020 $407,530 1,762 0.21
738 TEN PENNY DR 07/22/2020 $414,600 1,762 0.21
2179 KINGSTON CANYON DR 06/09/2020 $399,856 1,762 0.21
2163 KINGSTON CANYON DR 04/06/2020 $418,412 1,762 0.20
2155 KINGSTON CANYON DR 03/06/2020 $392,844 1,762 0.21
570 COULEE MEADOW DR 02/27/2020 $380,653 1,762 0.20
1219 SPRUCE MEADOWS DR 02/04/2020 $417,169 1,762 0.21
710 TEN PENNY DR 12/15/2020 $536,064 0.24
2203 KINGSTON CANYON DR 12/07/2020 $480,933 0.23
2199 KINGSTON CANYON DR 12/02/2020 $468,057 0.20
Silver+Vista_opt.jpg

Make sure that if you visit a new construction sales center--even merely to collect initial information--take Ken or Alicia with you. Visit our website for more information on ongoing new construction projects in Reno-Sparks.

The information herein is based upon data from the Washoe County Assessor's Office for the time period specified. It is deemed reliable but not guaranteed; you are advised to independently assess the accuracy of any information presented.

2020 New Construction Sales Statistics - Desert Plains

In February, 2021, I will be posting 2020 sales data for each ongoing new construction subdivision in the Reno/Sparks market. This information is extracted from data published by the Washoe County Assessor. The square footage shown is from the assessor. Builders’ plans and the assessor’s measurements are often different. I have tried to pair the square footage with the corresponding floor plan advertised by the builder. This data includes only homes sold by the builder (resales have been omitted).

The homes in the Desert Plains at Regency Park subdivision are built by Artisan Communities. The average sales price of the 25 new construction homes sold in this neighborhood in 2020 was $345,586. The highest sales price was $381,966.

Desert Plains
Address Sales Date Sales Price Sq Ft Lot Size
14381 LEIDEN DR 11/09/2020 $373,959 2,194 0.16
14453 LEIDEN DR 09/24/2020 $381,966 2,194 0.15
14421 LEIDEN DR 09/03/2020 $375,253 2,194 0.17
14356 LEIDEN DR 08/11/2020 $374,474 2,194 0.15
14364 LEIDEN DR 07/17/2020 $371,712 2,194 0.15
14396 LEIDEN DR 03/05/2020 $377,017 2,194 0.22
14428 LEIDEN DR 01/29/2020 $377,141 2,194 0.20
14373 LEIDEN DR 11/19/2020 $347,990 1,800 0.19
14397 LEIDEN DR 10/27/2020 $342,517 1,800 0.15
14417 LEIDEN DR 10/26/2020 $349,047 1,800 0.17
14425 LEIDEN DR 09/16/2020 $339,792 1,800 0.16
14461 LEIDEN DR 07/31/2020 $344,188 1,800 0.19
14360 LEIDEN DR 07/13/2020 $342,307 1,800 0.16
14437 LEIDEN DR 06/22/2020 $359,735 1,800 0.16
14444 LEIDEN DR 04/17/2020 $340,088 1,800 0.16
14365 LEIDEN DR 12/04/2020 $328,100 1,587 0.21
14389 LEIDEN DR 12/02/2020 $330,164 1,587 0.15
14413 LEIDEN DR 09/23/2020 $324,000 1,587 0.15
14429 LEIDEN DR 06/26/2020 $334,215 1,587 0.16
14420 LEIDEN DR 03/26/2020 $325,002 1,587 0.20
14452 LEIDEN DR 03/13/2020 $324,195 1,587 0.15
14436 LEIDEN DR 03/06/2020 $325,056 1,587 0.18
14348 LEIDEN DR 01/30/2020 $325,001 1,587 0.15
14405 LEIDEN DR 09/30/2020 $316,732 1,439 0.15
14445 LEIDEN DR 09/03/2020 $310,000 1,439 0.15
Desert+Plains_opt.jpg

Make sure that if you visit a new construction sales center--even merely to collect initial information--take Ken or Alicia with you. Visit our website for more information on ongoing new construction projects in Reno-Sparks.

The information herein is based upon data from the Washoe County Assessor's Office for the time period specified. It is deemed reliable but not guaranteed; you are advised to independently assess the accuracy of any information presented.

2020 New Construction Sales Statistics - Silver Vista

In February, 2021, I will be posting 2020 sales data for each ongoing new construction subdivision in the Reno/Sparks market. This information is extracted from data published by the Washoe County Assessor. The square footage shown is from the assessor. Builders’ plans and the assessor’s measurements are often different. I have tried to pair the square footage with the corresponding floor plan advertised by the builder. This data includes only homes sold by the builder (resales have been omitted).

The homes in the Silver Vista at Cyan subdivision were built by Silverado Homes. The average sales price of the 27 new construction homes sold in this neighborhood in 2020 was $406,394. The highest sales price was $460,360.

Silver Vista
Address Sales Date Sales Price Sq Ft Lot Size
2033 HARMONY VALLEY WAY 05/15/2020 $460,360 2,126 0.11
2335 SOPRANO DR 02/20/2020 $430,581 2,126 0.09
2285 SYMPHONY WAY 01/07/2020 $421,550 2,126 0.11
2014 HARMONY VALLEY WAY 08/25/2020 $404,380 2,028 0.08
2030 HARMONY VALLEY WAY 05/19/2020 $428,158 2,028 0.12
2385 SOPRANO DR 04/30/2020 $425,227 2,028 0.09
2025 HARMONY VALLEY WAY 04/21/2020 $429,121 2,028 0.08
2375 SOPRANO DR 03/27/2020 $416,803 2,028 0.11
2340 SOPRANO DR 03/20/2020 $420,202 2,028 0.08
2345 SOPRANO DR 02/27/2020 $414,150 2,028 0.09
2330 SOPRANO DR 02/14/2020 $420,543 2,028 0.08
2295 SOPRANO DR 02/06/2020 $417,199 2,028 0.13
2026 HARMONY VALLEY WAY 01/31/2020 $429,900 2,028 0.10
2305 SOPRANO DR 01/17/2020 $410,992 2,028 0.11
2018 HARMONY VALLEY WAY 08/21/2020 $395,692 1,711 0.09
2360 SOPRANO DR 05/05/2020 $396,706 1,711 0.09
2395 SOPRANO DR 04/29/2020 $383,519 1,711 0.10
2350 SOPRANO DR 03/23/2020 $391,543 1,711 0.08
2022 HARMONY VALLEY WAY 02/28/2020 $405,900 1,711 0.10
2320 SOPRANO DR 02/18/2020 $401,871 1,711 0.09
2315 SOPRANO DR 01/21/2020 $378,858 1,711 0.09
2017 HARMONY VALLEY WAY 05/22/2020 $373,039 1,302 0.09
2021 HARMONY VALLEY WAY 05/19/2020 $397,731 1,302 0.09
2029 HARMONY VALLEY WAY 04/15/2020 $388,896 1,302 0.09
2365 SOPRANO DR 03/27/2020 $396,933 1,302 0.09
2355 SOPRANO DR 03/10/2020 $370,039 1,302 0.09
2325 SOPRANO DR 01/31/2020 $362,755 1,302 0.09
Silver+Hills_opt.jpg

Make sure that if you visit a new construction sales center--even merely to collect initial information--take Ken or Alicia with you. Visit our website for more information on ongoing new construction projects in Reno-Sparks.

The information herein is based upon data from the Washoe County Assessor's Office for the time period specified. It is deemed reliable but not guaranteed; you are advised to independently assess the accuracy of any information presented.

2020 New Construction Sales Statistics - TerReno

In February, 2021, I will be posting 2020 sales data for each ongoing new construction subdivision in the Reno/Sparks market. This information is extracted from data published by the Washoe County Assessor. The square footage shown is from the assessor. Builders’ plans and the assessor’s measurements are often different. I have tried to pair the square footage with the corresponding floor plan advertised by the builder. This data includes only homes sold by the builder (resales have been omitted).

The homes in the TerReno subdivision are built by DiLoreto Homes. The average sales price of the 42 new construction homes sold in this neighborhood in 2020 was $513,146. The highest sales price was $620,218.

TerReno
Address Sales Date Sales Price Sq Ft Lot Size
548 RIVERBED CIR 9/8/2020 $553,967 2,415 0.26
571 RIVERBED CIR 7/10/2020 $541,465 2,415 0.21
584 RIVERBED CIR 7/7/2020 $567,204 2,415 0.18
559 RIVERBED CIR 10/14/2020 $548,670 2,373 0.16
566 RIVERBED CIR 8/21/2020 $545,762 2,373 0.16
607 RIVERBED CIR 5/22/2020 $519,375 2,373 0.15
608 RIVERBED CIR 4/28/2020 $516,446 2,373 0.15
512 RIVERBED CIR 7/7/2020 $650,000 2,281 0.27
590 RIVERBED CIR 5/12/2020 $548,255 2,281 0.27
614 RIVERBED CIR 5/8/2020 $588,165 2,281 0.19
620 RIVERBED CIR 5/5/2020 $536,041 2,281 0.3
531 RIVERBED CIR 4/30/2020 $520,020 2,281 0.21
505 RIVERBED CIR 4/7/2020 $528,121 2,281 0.19
518 RIVERBED CIR 2/21/2020 $592,500 2,245 0.21
572 RIVERBED CIR 7/31/2020 $539,714 2,086 0.16
577 RIVERBED CIR 7/14/2020 $502,544 2,086 0.2
511 RIVERBED CIR 5/6/2020 $549,688 2,086 0.19
632 RIVERBED CIR 4/3/2020 $545,439 2,086 0.15
565 RIVERBED CIR 8/25/2020 $491,994 1,945 0.2
560 RIVERBED CIR 8/21/2020 $576,389 1,945 0.16
637 RIVERBED CIR 4/3/2020 $510,072 1,945 0.19
501 RIVERBED CIR 3/27/2020 $476,272 1,945 0.17
536 RIVERBED CIR 3/3/2020 $494,342 1,945 0.15
596 RIVERBED CIR 5/12/2020 $507,402 1,854 0.2
619 RIVERBED CIR 11/20/2020 $475,000 1,847 0.16
555 RIVERBED CIR 9/15/2020 $513,418 1,847 0.16
542 RIVERBED CIR 9/8/2020 $473,392 1,847 0.17
554 RIVERBED CIR 8/28/2020 $452,972 1,847 0.18
601 RIVERBED CIR 6/19/2020 $500,116 1,847 0.17
619 RIVERBED CIR 5/19/2020 $457,111 1,847 0.16
578 RIVERBED CIR 7/29/2020 $484,858 1,660 0.14
633 RIVERBED CIR 6/16/2020 $418,758 1,660 0.16
602 RIVERBED CIR 5/5/2020 $432,432 1,660 0.13
626 RIVERBED CIR 4/16/2020 $455,888 1,660 0.16
638 RIVERBED CIR 3/13/2020 $452,111 1,660 0.16
530 RIVERBED CIR 2/28/2020 $418,439 1,660 0.13
506 RIVERBED CIR 2/7/2020 $446,020 1,660 0.17
1731 ROSE SUMMIT LN 12/28/2020 $501,694 0.18
1705 ROSE SUMMIT LN 12/23/2020 $620,218 0.31
1709 ROSE SUMMIT LN 12/18/2020 $491,486 0.18
1713 ROSE SUMMIT LN 11/23/2020 $514,456 0.16
1717 ROSE SUMMIT LN 11/17/2020 $493,920 0.16
TerReno_opt.jpg

Make sure that if you visit a new construction sales center--even merely to collect initial information--take Ken or Alicia with you. Visit our website for more information on ongoing new construction projects in Reno-Sparks.

The information herein is based upon data from the Washoe County Assessor's Office for the time period specified. It is deemed reliable but not guaranteed; you are advised to independently assess the accuracy of any information presented.

2020 New Construction Sales Statistics - Falcon Ridge

In February, 2021, I am posting 2020 sales data for each ongoing new construction subdivision in the Reno/Sparks market. This information is extracted from data published by the Washoe County Assessor. The square footage shown is from the assessor. Builders’ plans and the assessor’s measurements are often different. I have tried to pair the square footage with the corresponding floor plan advertised by the builder. This data includes only homes sold by the builder (resales have been omitted).

The homes in the Falcon Ridge subdivision are built by Desert Wind Homes. The average sales price of the 48 new construction homes sold in this neighborhood in 2020 was $317,728. The highest sales price was $339,972.

Falcon Ridge by Desert Wind
Address Sales Date Sales Price Sq Ft Lot Size
1060 BIG ROCK LOOP 07/17/2020 $325,707 1,774 0.04
1044 BIG ROCK LOOP 06/19/2020 $319,990 1,774 0.04
1016 BIG ROCK LOOP 05/07/2020 $312,990 1,774 0.04
1019 BIG ROCK LOOP 04/24/2020 $324,650 1,774 0.04
1011 BIG ROCK LOOP 04/17/2020 $332,200 1,774 0.04
1052 BIG ROCK LOOP 04/13/2020 $327,545 1,774 0.04
1036 BIG ROCK LOOP 03/04/2020 $321,592 1,774 0.04
1028 BIG ROCK LOOP 02/28/2020 $321,130 1,774 0.04
4843 BLACK FALCON WAY 11/19/2020 $319,418 1,748 0.04
4855 BLACK FALCON WAY 10/21/2020 $332,504 1,748 0.04
4831 BLACK FALCON WAY 10/06/2020 $326,164 1,748 0.04
4838 BLACK FALCON WAY 08/14/2020 $315,978 1,748 0.04
4826 BLACK FALCON WAY 08/13/2020 $329,076 1,748 0.04
4850 BLACK FALCON WAY 07/23/2020 $318,850 1,748 0.04
4724 BLACK FALCON WAY 06/19/2020 $299,990 1,748 0.04
4760 BLACK FALCON WAY 05/22/2020 $304,000 1,748 0.04
4712 BLACK FALCON WAY 05/07/2020 $312,990 1,748 0.04
4748 BLACK FALCON WAY 04/24/2020 $304,000 1,748 0.04
1024 BIG ROCK LOOP 07/17/2020 $317,990 1,741 0.04
1056 BIG ROCK LOOP 05/07/2020 $312,990 1,741 0.04
1015 BIG ROCK LOOP 04/23/2020 $324,371 1,741 0.04
1023 BIG ROCK LOOP 04/22/2020 $339,721 1,741 0.04
1040 BIG ROCK LOOP 04/13/2020 $322,417 1,741 0.04
1048 BIG ROCK LOOP 04/09/2020 $316,349 1,741 0.04
1012 BIG ROCK LOOP 03/12/2020 $315,490 1,741 0.04
1032 BIG ROCK LOOP 03/12/2020 $312,625 1,741 0.04
4759 BLACK FALCON WAY 01/22/2020 $312,084 1,741 0.04
4849 BLACK FALCON WAY 10/16/2020 $296,662 1,635 0.04
4837 BLACK FALCON WAY 10/07/2020 $303,218 1,635 0.04
4825 BLACK FALCON WAY 10/02/2020 $296,696 1,635 0.04
4832 BLACK FALCON WAY 08/12/2020 $296,823 1,635 0.04
4844 BLACK FALCON WAY 08/07/2020 $297,501 1,635 0.04
4856 BLACK FALCON WAY 07/24/2020 $296,490 1,635 0.04
4718 BLACK FALCON WAY 03/20/2020 $299,081 1,635 0.04
4706 BLACK FALCON WAY 01/21/2020 $296,036 1,635 0.04
4565 FALCON ROCK LN 12/22/2020 $301,227 0.04
4892 BLACK FALCON WAY 12/15/2020 $326,797 0.04
4868 BLACK FALCON WAY 12/11/2020 $332,632 0.04
4886 BLACK FALCON WAY 12/11/2020 $323,039 0.04
4880 BLACK FALCON WAY 12/08/2020 $349,059 0.04
4874 BLACK FALCON WAY 12/07/2020 $319,820 0.04
4862 BLACK FALCON WAY 12/03/2020 $334,202 0.04
4600 FALCON ROCK LN 11/20/2020 $328,198 0.04
4594 FALCON ROCK LN 11/16/2020 $313,110 0.04
4588 FALCON ROCK LN 11/13/2020 $327,965 0.04
4582 FALCON ROCK LN 11/12/2020 $318,108 0.04
4576 FALCON ROCK LN 11/04/2020 $339,972 0.04
4570 FALCON ROCK LN 11/03/2020 $331,487 0.04
Falcon+Ridge_opt.jpg

Make sure that if you visit a new construction sales center--even merely to collect initial information--take Ken or Alicia with you. Visit our website for more information on ongoing new construction projects in Reno-Sparks.

The information herein is based upon data from the Washoe County Assessor's Office for the time period specified. It is deemed reliable but not guaranteed; you are advised to independently assess the accuracy of any information presented.